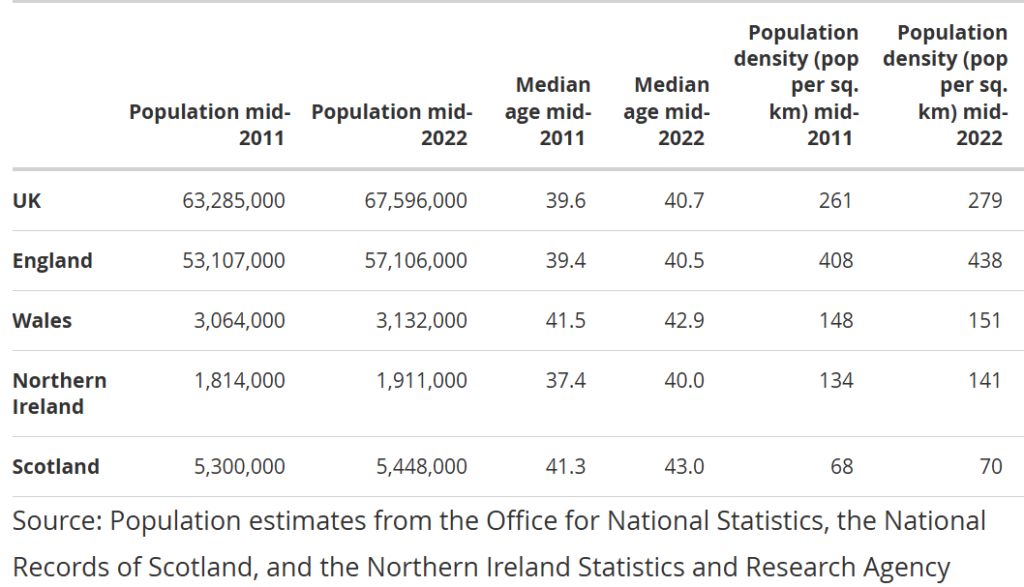
Population of the UK and its constituent countries, mid-2022 and mid-2011
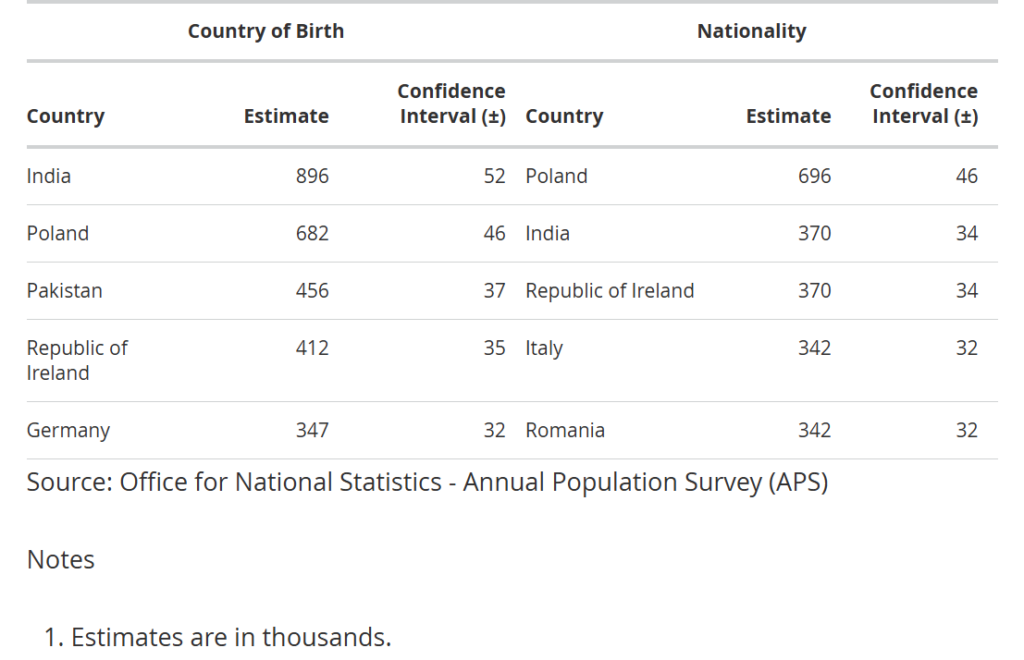
Population of the UK for the five most common non-UK countries of birth and nationalities, year ending June 2021
Population of England and Wales by ethnicity (excluding White British)

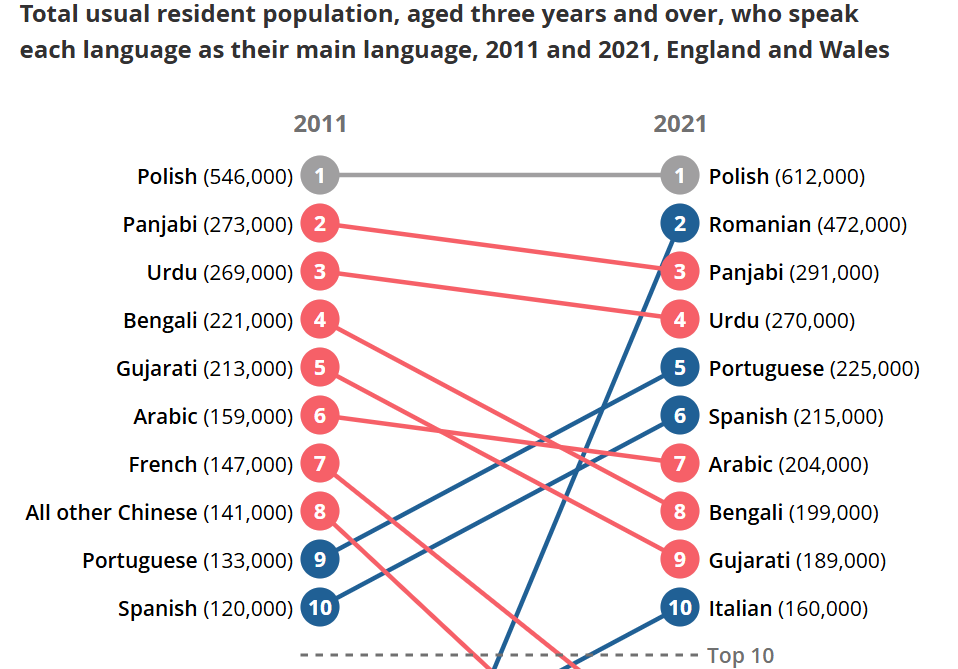
The top ten main languages spoken in England and Wales, excluding English (English or Welsh in Wales)
A National Statistics Publication for Scotland
Country by Ethnic group – 21 groups, all by Individuals
More than 1.5 million people said they could speak Scots.
Another 267,000 people said they could understand Scots but not read, write or speak the language.
1.1% of adults said they spoke Scots at home. The Shetland Islands, Aberdeenshire, Moray and Orkney Islands had the highest proportions of Scots speakers at home.
Just over 57,000 people said they could speak Gaelic.
This was a fall from 59,000 in the 2001 census. 23,000 people said they could understand Gaelic, but not read, write, or speak it.
Council areas with the most Gaelic speakers were:
- Eilean Siar (Western Isles), where 52.3% of the population could speak Gaelic
- Highland, where 5.4% could speak Gaelic
- Argyll and Bute, where 4.0% could speak Gaelic
These were also the areas were people most commonly spoke Gaelic at home. Overall, 0.5% of adults in Scotland said they spoke Gaelic at home.
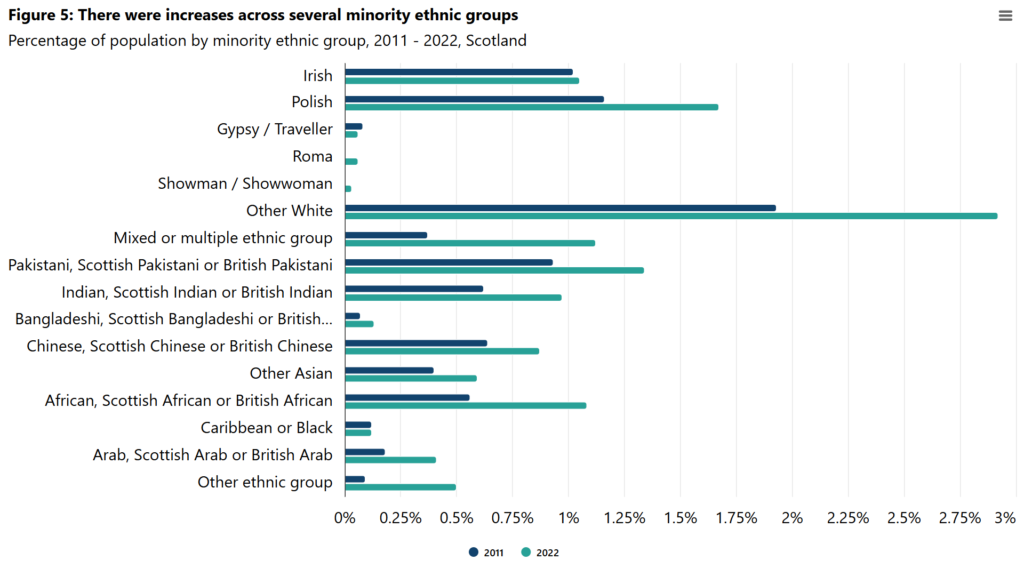
Polish was the most commonly spoken language in Scotland after English, Scots and Gaelic.
54,000 people – about 1.1% of Scotland’s population – said they spoke Polish at home.
Languages other than English, Scots and Gaelic were most common in the big cities. About 12% of people in Aberdeen, Edinburgh and Glasgow said they spoke other languages around the home.
The most commonly spoken languages at home other than English and Scots were:
- Polish (54,186 people)
- Urdu (23,394 people)
- Punjabi languages (23,150 people)
- Chinese languages (16,830 people)
- French (14,623 people)
• The non-British population of Scotland was 397,000 (7.4%) in the year to mid2021. The non-UK born population was 523,000 (9.7%).
• Numbers of non-British nationals and non-UK born people remained broadly
stable compared to the previous year.
• Of all non-British nationals in Scotland, 231,000 (58%) were EU nationals and
165,000 (42%) were non-EU nationals.
• Of all non-UK born people living in Scotland, 258,000 (49%) were born in the
EU and 265,000 (51%) were born outside the EU.
• Polish was the most common non-British nationality and Poland was the most
common non-UK country of birth in Scotland.
Northern Ireland

In 2021, 31.86% of All Usual Residents declared their national identity as
British Only; 29.13% selected Irish Only; and 19.78% stated Northern Irish
Only. Since 2011, those declaring themselves as British Only and
Northern Irish Only has declined by approximately 8 percentage points
and 2 percentage points respectively in their share of the national identity
categories.
Other National Identities accounted for approximately one-fifth of the All
Usual Residents in the Northern Irish population. The highest of these
were Polish (1.25%, 23,862), Lithuanian (0.62%, 11,879), Romanian
(0.37%, 7,056) and Portuguese (0.36%, 6,853).
There were some differences between the counts of
Main language of usual residents aged 3 and over – Census 2021

